Sample Burning Conditions
Spread Event Days Daily Burning Hours Daily Weather Weather Sampling OptionsAdvanced
Deterministic Ignition Location Deterministic Burn Conditions Fire Resampling Options DistributionsOutput
Output Fire Statistics Table Output Burn Probability Output Relative Burn Probability Output Burn Count Output Burn Map Output Fire Perimeters Output Individual Burn Maps Output Burn Tables Output Rate of Spread Map Output Rate of Spread Summary Map Output Fire Intensity Map Output Fire Intensity Summary Map Output Spread Direction Map Output Spread Direction Summary Map Output Surface Fuel Consumption Map Output Surface Fuel Consumption Summary Map Output Crown Fraction Burned Map Output Crown Fraction Burned Summary Map Output Crown Fraction Consumed Map Output Crown Fraction Consumed Summary Map Output Total Fuel Consumption Map Output Total Fuel Consumption Summary MapBurnP3+
In SyncroSim Studio, the following scenario datasheets can be accessed by right-clicking on a scenario name in the Explorer, selecting Open from the context menu, and navigating to the BurnP3+ tab.
Run Control
Datasheet internal name: burnP3Plus_RunControl
The Run Control datasheet can be found under the BurnP3+ tab and contains information about the number of iterations, or Monte Carlo realizations, in the scenario.
This datasheet is an input for the Sample Ignitions, Sample Burning Conditions, Fire Growth, and Summarize Burn Probability transformers.
Number of Iterations
Column internal name: MaximumIteration
Sets the number of iterations to run the model.
Data Type: Integer
Default: 1
Landscape Maps
Datasheet internal name: burnP3Plus_LandscapeRasters
The Landscape Maps datasheet can be found under the BurnP3+ tab and contains spatial information about the study area.
This datasheet contains raster files (.tif) relevant to the associated study area. In SyncroSim Studio, the raster file can be selected by clicking on the yellow folder icon, removed by clicking on the trash can icon, and exported by clicking on the export icon. If generating the model programmatically from R or Python, the raster file column should be the absolute path to the corresponding raster file.
All landscape maps are required to be of the same projection, extent, and origin. BurnP3+ must also be able to project coordinates from EPSG:4326 to the projection used here. Appropriate local UTM projections are preferred to ensure that North is properly aligned with the grid.
This datasheet is an input for the Sample Ignitions, Sample Burning Conditions, and Fire Growth transformers.
Fuel
Column internal name: FuelGridFileName
A raster file (.tif) input where each pixel is an integer value representing a fuel type in the study area. The fuel type values in this raster must correspond to the fuel type IDs provided in the project Fuel Types datasheet.
Data Type: String
Elevation
Column internal name: ElevationGridFileName
Optional. A raster file (.tif) input that contains the elevation (m) of each pixel in the study area.
Data Type: String
Fire Zone
Column internal name: FireZoneGridFileName
Optional. A raster file (.tif) input that contains the fire zones in the study area. The fire zone values in this raster must correspond to the fire zone IDs provided in the project Fire Zones datasheet.
Note: fire zones do not directly affect fire behaviour; instead, they are assigned to cell values in the corresponding maps, and are used to spatially stratify ignition sampling distributions, weather streams, etc.
Data Type: String
Weather Zone (Optional)
Column internal name: WeatherZoneGridFileName
Optional. A raster file (.tif) input that contains the weather zones in the study area. The weather zone values in this raster must correspond to the weather zone IDs provided in the project-scoped Weather Zones datasheet.
Data Type: String
Sample Ignitions
The Sample Ignitions transformer is responsible for identifying where ignitions fall on the landscape along with other sampling conditions such as season, cause, etc., which can be used to modify sampling later in the pipeline. The results of this sampling are used to populate the Deterministic Ignition Location datasheet. For a fully deterministic run, users can forgo running this transformer and fill the Deterministic Ignition Location datasheet directly. Datasheets in this node are used to configure this transformer.
Ignition Count
Datasheet internal name: burnP3Plus_IgnitionsPerIteration
The Ignition Count datasheet can be found under the Sample Ignitions node and contains information about how the fire ignitions are sampled.
This datasheet is an input for the Sample Ignitions transformer.
Ignition Count
Column internal name: Mean
Defines the number of sampled ignitions per iteration.
To deterministically assign an ignition count value using this column, the Ignition Count Distribution column in this datasheet must be empty (even if hidden by right clicking anywhere in the datasheet window and deselecting the desired column from the context menu). If the Ignition Count column contains multiple values, and the Ignition Count Distribution column is empty, the Ignition Count rows will be sampled with a uniform probability.
Data Type: Double
Default: 1
Ignition Count Distribution
Column internal name: DistributionType
Optional. Defines the type of distribution used to sample ignition counts.
To set a user-defined distribution in this datasheet, the name of the distribution must first be specified in the project Distributions datasheet. Then, the associated Values and Relative Frequencies of each user defined distribution must be defined in the scenario Distributions datasheet under the Advanced node. When creating a user-defined distribution, all other columns in this datasheet should be ignored.
To use a built-in statistical distribution type (i.e., Normal, or Gamma), set this column to either Normal, or Gamma, and specify a value for Ignition Count (mean), and Ignition Count SD (if not, the defaults will be set to 1). The Ignition Count Min and Ignition Count Max may also be specified to prevent extreme values from being sampled (by default the Min is set to 1, and the Max is set to Inf).
Built-in: Normal and Gamma statistical distributions
Data Type: List Item
Ignition Count SD
Column internal name: DistributionSD
Optional. Defines the standard deviation of the ignition count distribution.
Note: this column is only respected for the built-in statistical distribution type.
Data Type: Double
Default: 1
Ignition Count Min
Column internal name: DistributionMin
Optional. Defines the minimum ignition count to be sampled.
Note: this column is only respected for the built-in statistical distribution type.
Data Type: Double
Default: 1
Ignition Count Max
Column internal name: DistributionMax
Optional. Defines the maximum ignition count to be sampled.
Note: this column is only respected for the built-in statistical distribution type.
Data Type: Double
Default: Inf
Ignition Count Distribution Examples
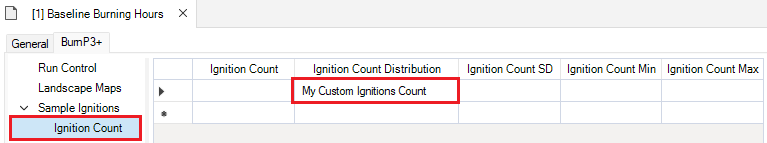
1. How to set a fixed ignition count
To deterministically set a fixed ignition count, provide a single value in the Ignition Count column. The Ignition Count Distribution column must be empty (even if it is hidden).
For example, to tell the model to only sample a single ignition for each iteration, you would set up of the Ignition Count Distribution datasheet in the following way:
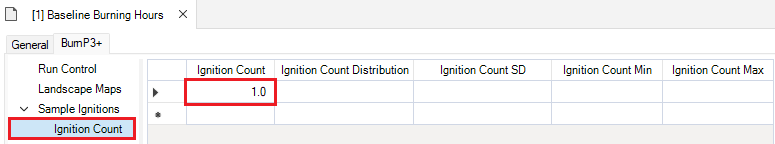
Note: to unhide columns in this datasheet, right click anywhere in the datasheet window, and select the hidden column from the context menu. To hide a column, right click anywhere in the datasheet window and deselect the desired column from the context menu.
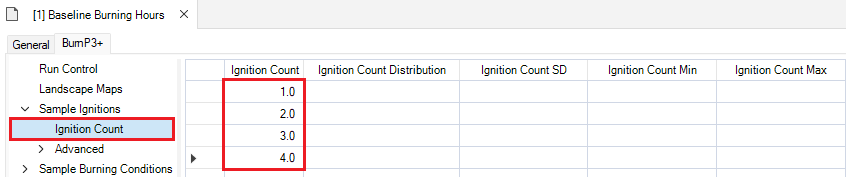
2. How to set an equal probability distribution
To set an equal probability distribution, provide multiple rows of values in the Ignition Count column. Each value in the Ignition Count column will be sampled with an equal likelihood (in this case, each value has a 25% chance of being sampled). The Ignition Count Distribution column must be empty (even if it is hidden).
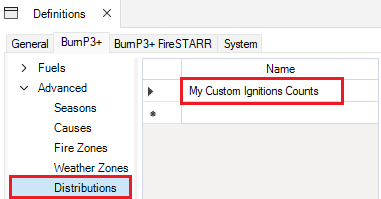
3. How to set a user-defined distribution
To set a user-defined distribution, a distribution name must first be specified in the project Distributions datasheet under the BurnP3+ | Advanced node.
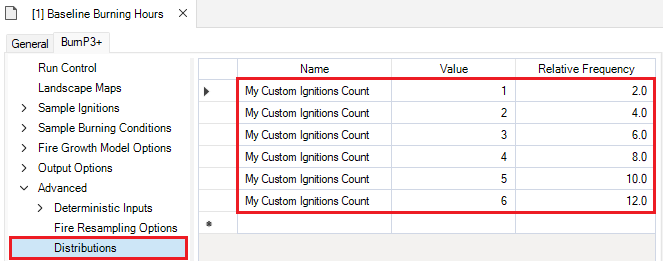
Next, add Values and Relative Frequencies for the distribution in the scenario Distributions datasheet. The Relative Frequency values are normalized by dividing by the sum of all values in the Relative Frequency column and therefore do no need to sum to one hundred. For instance, in the example below the sum of the values in the Relative Frequency column is 14, so the likelihood that a value of “4” will be sampled is 4/14, or ~29%.
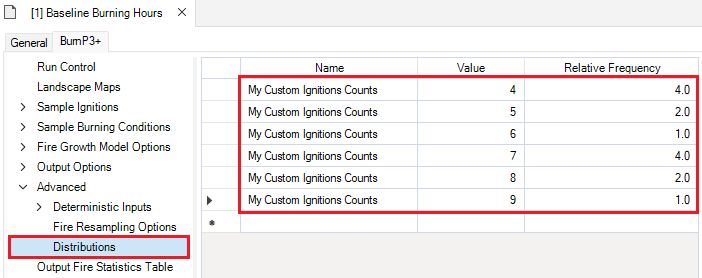
Next, in the Sample Ignitions | Ignition Count datasheet, ensure that the Ignition Count, Ignition Count SD, Ignition Count Min, and Ignition Count Max columns are empty. Then, assign the defined Distribution in the Ignition Count Distribution column.
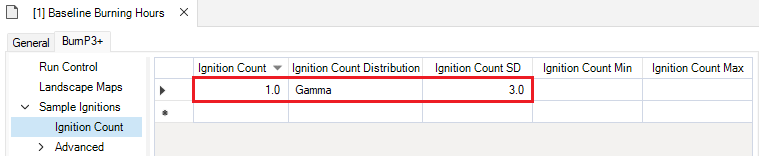
4. How to set a built-in Statistical distribution
Users may choose between two built-in Statistical distributions: Normal or Gamma. Specify the distribution type in the Ignition Count Distribution column by choosing one of the options from the dropdown menu, and set values for Ignition Count (mean), and Ignition Count SD (otherwise, both Ignition Count, and Ignition Count SD will default to 1). Optionally, users may specify values for Ignition Count Min, and Ignition Count Max to prevent extreme values.
Ignition Location
Datasheet internal name: burnP3Plus_ProbabilisticIgnitionLocation
The Ignition Location datasheet can be found under the Sample Ignitions node and contains information about the location of fire ignitions.
This datasheet is an input for the Sample Ignitions transformer.
Probabilistic Ignition Grid
Column internal name: IgnitionGridFileName
A raster file (.tif) input where each pixel corresponds to the relative likelihood of an ignition starting at that specific location within the study area. In SyncroSim Studio, the raster file can be selected by clicking on the yellow folder icon, removed by clicking on the trash can icon, and exported by clicking on left-turn arrow icon. If generating the model programmatically from R or Python, the value in this column should be the absolute path to the corresponding raster file.
Data Type: String
Season
Column internal name: Season
Optional. Specifies the season for which this probabilistic ignition grid should be used. Use this option if the probabilistic ignition grid changes across seasons.
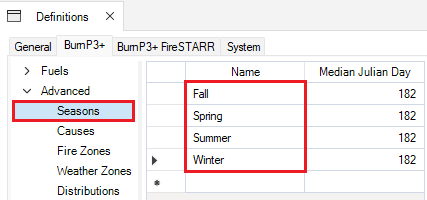
Seasons are defined in the project Seasons datasheet under the Advanced node.
Data Type: List Item
Cause
Column internal name: Cause
Optional. Defines the location of fire ignitions based on a specific cause. Use this option if the probabilistic ignition grid changes by cause.
Causes are defined in the project Causes datasheet under the Advanced node.
Data Type: List Item
Note: if this datasheet is left empty, ignitions will be sampled uniformly across all non-restricted cells in the landscape.
Ignition Restrictions
Datasheet internal name: burnP3Plus_IgnitionRestriction
The Ignition Restrictions datasheet can be found under the Sample Ignitions node and contains information about fire ignition restrictions that define the conditions and locations where ignitions can be sampled.
This datasheet is an input for the Sample Ignitions transformer.
Fuel Type
Column internal name: FuelType
Defines the fuel type(s) in which fires cannot ignite. However, it is possible that fires ignited in non-restricted fuel types may burn into restricted fuel types if allowed by the fire growth model.
Fuel types are defined in the project Fuel Types datasheet under the Fuels node.
Data Type: List Item
Season
Column internal name: Season
Optional. Specifies the season for which this ignition restriction should apply.
Seasons are defined in the project Seasons datasheet under the Advanced node.
Note: To fully restrict ignition sampling for a specific combination of Season, Cause, and Fire Zone, you may leave the Fuel Type column blank.
Data Type: List Item
Cause
Column internal name: Cause
Optional. Specifies the cause for which this ignition restriction should apply.
Causes are defined in the project Causes datasheet under the Advanced node.
Note: To fully restrict ignition sampling for a specific combination of Season, Cause, and Fire Zone, you may leave the Fuel Type column blank.
Data Type: List Item
Fire Zone
Column internal name: FireZone
Optional. Specifies the fire zone for which this ignition restriction should apply.
Fire zones are defined in the project Fire Zones datasheet under the Advanced node.
Note: To fully restrict ignition sampling for a specific combination of Season, Cause, and Fire Zone, you may leave the Fuel Type column blank.
Data Type: List Item
Ignition Restrictions Examples
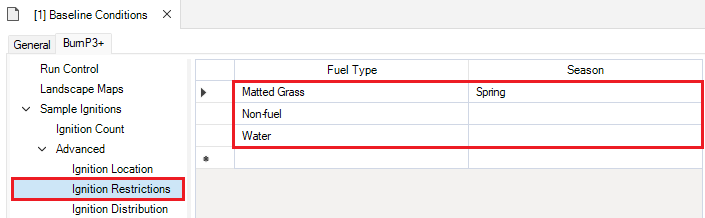
1. Adding Ignition Restrictions
The Ignition Restrictions datasheet in the BurnP3+Prometheus template library’s Baseline Conditions scenario outlines how Fuel Type, and Season can be used to restrict ignitions.
Here, we can see that the ignitions cannot occur in the Matted Grass (O-1a) fuel type in the Spring, as well as in areas of Non-fuel, and Water.
Ignition Distribution
Datasheet internal name: burnP3Plus_IgnitionDistribution
The Ignition Distribution datasheet can be found under the Sample Ignitions node and contains information about how ignitions should be assigned to seasons, causes, and/or fire zones. This information can then be used to stratify ignition locations, burning conditions, etc.
This datasheet is an input for the Sample Ignitions transformer.
Relative Likelihood
Column internal name: RelativeLikelihood
Defines the relative likelihood used to decide what Season, Cause, Fire Zone (etc.), should be assigned to each ignition. Note that these values are normalized by dividing by the sum of all values in the Relative Likelihood column and therefore do not need to add up to one hundred.
Data Type: Double
Season
Column internal name: Season
Optional. Defines the season to be assigned to the ignition. This must be associated with a value for Relative Likelihood.
Seasons are defined in the project Seasons datasheet under the Advanced node.
Data Type: List Item
Cause
Column internal name: Cause
Optional. Defines the cause to be assigned to the ignition. This must be associated with a value for Relative Likelihood.
Causes are defined in the project Causes datasheet under the Advanced node.
Data Type: List Item
Fire Zone
Column internal name: FireZone
Optional. Defines the fire zone to be assigned to the ignition. This must be associated with a value for Relative Likelihood.
Fire zones are defined in the project Fire Zones datasheet under the Advanced node.
Data Type: List Item
Note: if a variable (e.g., Cause) is not specified in any row of this datasheet, ignitions will be assigned uniformly across all valid groups for that variable.
Ignition Count Distribution Examples
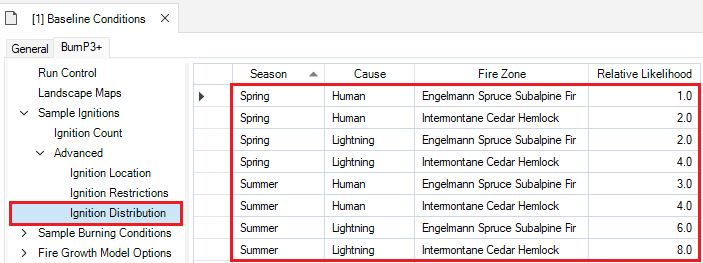
1. Adding Ignition Distributions
The Ignition Distribution datasheet in the BurnP3+Prometheus template library’s Baseline Conditions scenario outlines how Season, Cause, and Fire Zone can be used to sample fire ignitions.
Sample Burning Conditions
The Sample Burning Conditions transformer is responsible for how long each ignition should burn and the conditions under which fires will burn during this time. The results of this sampling are used to populate the Deterministic Burn Conditions datasheet. For a fully deterministic run, users can forgo running this transformer and fill the Deterministic Burn Conditions datasheet directly. Datasheets in this node are used configure this transformer.
Spread Event Days
Datasheet internal name: burnP3Plus_FireDuration
The Spread Event Days datasheet can be found under the Sample Burning Conditions node and contains information about how fire spread event days are sampled.
This datasheet is an input for the Sample Burning Conditions transformer.
Season
Column internal name: Season
Optional. Specifies the season for which this Spread Event Day sampling record should apply. Use this option if the Spread Event Days changes across seasons.
Seasons are defined in the project Seasons datasheet under the Advanced node.
Data Type: List Item
Fire Zone
Column internal name: FireZone
Optional. Specifies the fire zone for which this Spread Event Day sampling record should apply.
Fire Zones are defined in the project Fire Zones datasheet under the Advanced node.
Data Type: List Item
Fire Duration (Days)
Column internal name: Mean
Optional. Defines the number of days a fire burns. To deterministically assign a Fire Duration (Days) value using this column, the Fire Duration Distribution column in this datasheet must be empty (even if hidden). If the Fire Duration (Days) column contains multiple values, and the Fire Duration Distribution column is empty, the Fire Duration (Days) rows will be sampled with equal probability.
Data Type: Double
Fire Duration Distribution
Column internal name: DistributionType
Optional. Defines the distribution of days a fire burns.
To set a user-defined distribution in this datasheet, the distribution name must first be set in the project Distributions datasheet. The associated Value and Relative Frequency of each user-defined distribution are defined in the scenario Distributions datasheet under the Advanced node. When creating a user-defined distribution, all other columns in this datasheet should be ignored. Otherwise, other columns will need to be used to parameterize the distribution(s) (i.e., Normal, or Gamma).
To use a built-in statistical distribution type (i.e., Normal, or Gamma), set this column to either Normal or Gamma, and specify a value for Fire Duration (Days) (mean), and Fire Duration SD (standard deviation) (if not, the defaults will be set to 1). The Fire Duration Min and Fire Duration Max may also be specified to prevent extreme values from being sampled (by default the Min is set to 1, and the Max is set to Inf).
Note that if this column is filled, there should only be a single row for each unique combination of season, and fire zone.
Built-in: Normal and Gamma statistical distributions
Data Type: List Item
Fire Duration SD
Column internal name: DistributionSD
Optional. Defines the standard deviation of the fire burning duration (days) if the fire duration distribution type is set to a built-in statistical distribution.
Note: this column is only respected for the built-in statistical distribution type.
Data Type: Double
Fire Duration Min
Column internal name: DistributionMin
Optional. Defines the minimum fire burning duration (days) to be sampled.
Note: this column is only respected for the built-in statistical distribution type.
Data Type: Double
Fire Duration Max
Column internal name: DistributionMax
Optional. Defines the maximum fire burning duration (days) to be sampled.
Note: this column is only respected for the built-in statistical distribution type.
Data Type: Double
Fire Duration Distribution Examples
1. How to set fixed fire duration (days)
To deterministically set a fixed fire duration (days), provide a single value in the Fire Duration (Days) column. The Fire Duration Distribution column must be empty (even if it is hidden).
For example, to tell the model to burn each fire for exactly one day, you would set up of the Fire Duration Distribution datasheet in the following way:
Note: to unhide columns in this datasheet, right click anywhere in the datasheet window, and select the hidden column from the context menu. To hide a column, right click anywhere in the datasheet window and deselect the desired column from the context menu.
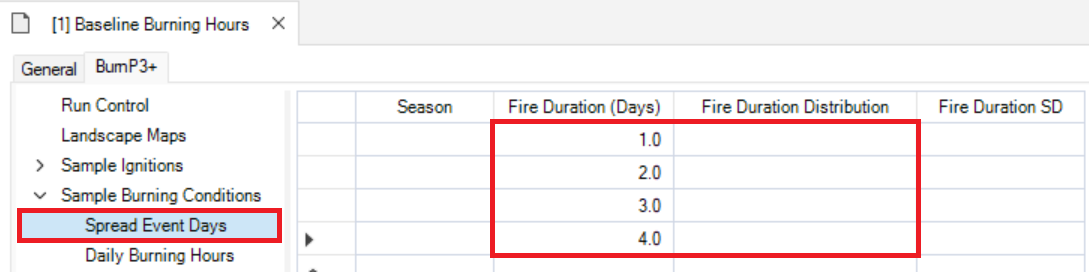
2. How to set an equal probability distribution
To set an equal probability distribution, provide multiple rows of values in the Fire Duration (Days) column. Each value in the Fire Duration (Days) column will be sampled with an equal likelihood (in this case, each value has a 25% chance of being sampled). The Fire Duration Distribution column must be empty (even if it is hidden). In this case, values will be sampled from the rows with equal probability.
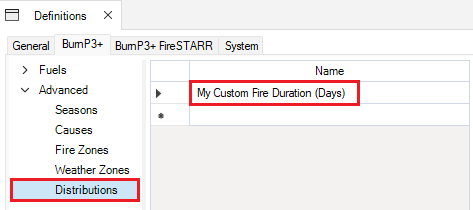
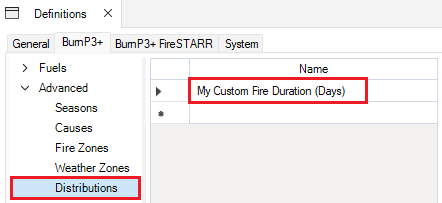
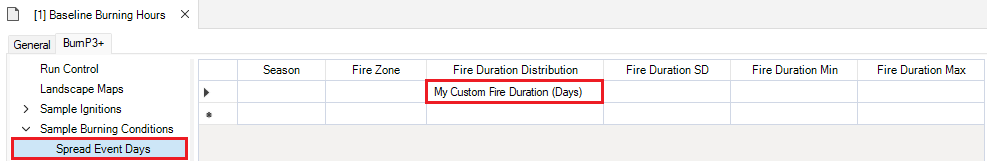
3. How to set a user-defined distribution
To set a user-defined distribution, a distribution name must first be specified in the project Distributions datasheet under the BurnP3+ | Advanced node.
Next, add Values and Relative Frequencies for the distribution in the scenario Distributions datasheet.
Then, assign the defined Distribution in the Fire Duration Distribution column of the Spread Event Days datasheet. Ensure that the Fire Duration (Days), Fire Duration SD, Fire Duration Min, and Fire Duration Max columns are empty.
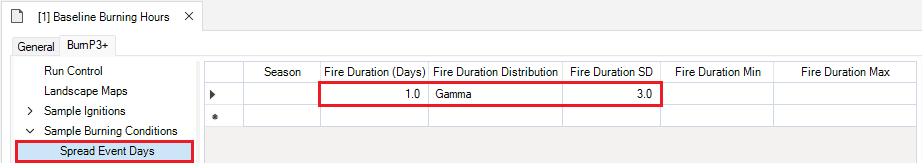
4. How to set a built-in Statistical distribution
Users may choose between two built-in Statistical distributions: Normal or Gamma. Specify the distribution type in the Fire Duration Distribution column by choosing one of the options from the dropdown menu, and set values for Fire Duration (Days) (mean), and Fire Duration SD (otherwise, both Fire Duration (Days), and Fire Duration SD will default to 1). Optionally, users may specify values for Fire Duration Min, and Fire Duration Max to prevent extreme values.
Daily Burning Hours
Datasheet internal name: burnP3Plus_HoursPerDayBurning
The Daily Burning Hours datasheet can be found under the Sample Burning Conditions node and contains information about how daily burning hours are sampled.
This datasheet is an input for the Sample Burning Conditions transformer.
Note: if this datasheet is left completely empty, BurnP3+ will default to 4 hours of burning per burn day and log a warning to the run log.
Season
Column internal name: Season
Specifies the season for which this Daily Burning Hours sampling record should apply
Seasons are defined in the project Seasons datasheet under the Advanced node.
Data Type: List Item
Daily Burning Hours
Column internal name: Mean
Optional. Defines the number of hours a fire burns in a day.
To deterministically assign a Daily Burning Hours value using this column, the Daily Burning Hours Distribution column in this datasheet must be empty (even if hidden). If the Daily Burning Hours column contains multiple values, and the Daily Burning Hours Distribution column is empty, the Daily Burning Hours rows will be sampled with equal probability.
Data Type: Double
Daily Burning Hours Distribution
Column internal name: DistributionType
Optional. Defines the type of distribution used to sample daily burning hours.
To set a user-defined distribution in this datasheet, it must first be set in the project Distributions datasheet. The associated Value and Relative Frequency of each user-defined distribution are defined in the scenario Distributions datasheet under the Advanced node. When creating a user-defined distribution, all other columns in this datasheet should be ignored.
To use a built-in statistical distribution type, set this column to either Normal or Gamma, and specify a value for Daily Burning Hours (mean), and Daily Burning Hours SD (standard deviation) (if not, the defaults will be set to 1). The Daily Burning Hours Min and Daily Burning Hours Max may also be specified to prevent extreme values from being sampled (by default the Min is set to 1, and the Max is set to Inf).
Note that if this column is filled, there should only be a single row for each unique combination of season.
Built-in: Normal and Gamma statistical distributions
Data Type: List Item
Daily Burning Hours SD
Column internal name: DistributionSD
Optional. Defines the standard deviation of the daily burning hours.
Data Type: Double
Daily Burning Hours Min
Column internal name: DistributionMin
Optional. Defines the minimum daily burning hours to be sampled.
Data Type: Double
Daily Burning Hours Max
Column internal name: DistributionMax
Optional. Defines the maximum daily burning hours to be sampled.
Data Type: Double
Daily Burning Hours Distribution Examples
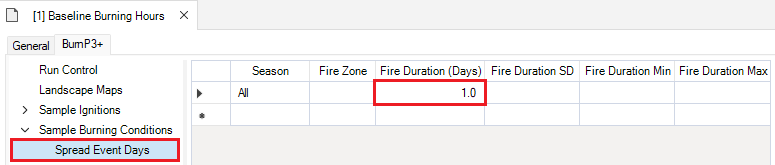
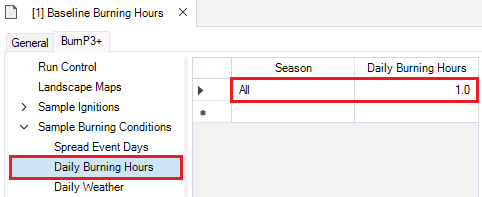
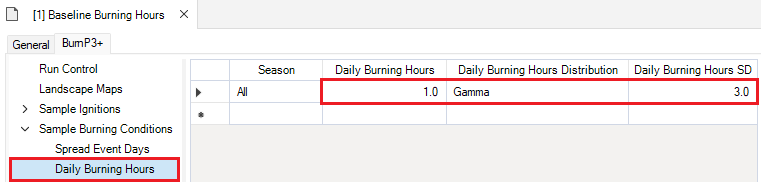
1. How to set fixed daily burning hours
To deterministically set a fixed daily burning hours, provide a single value in the Daily Burning Hours column. The Daily Burning Hours Distribution column must be empty (even if it is hidden). In this case, the Season column must also be filled with seasons defined in the project Seasons datasheet. “All” is a built-in option and is used as an explicit wild card for all seasons.
For example, to tell the model to burn each fire for exactly one day, you would set up the Daily Burning Hours Distribution datasheet in the following way:
Note: to unhide columns in this datasheet, right click anywhere in the datasheet window, and select the hidden column from the context menu. To hide a column, right click anywhere in the datasheet window and deselect the desired column from the context menu.
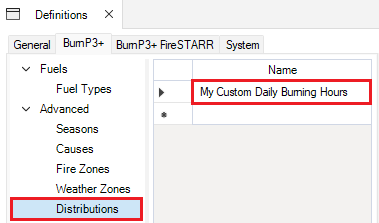
2. How to set a user-defined distribution
To set a user-defined distribution, a distribution name must first be specified in the project Distributions datasheet under the BurnP3+ | Advanced node.
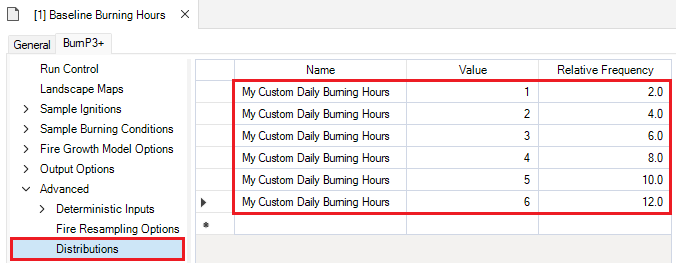
Next, add Values and Relative Frequencies for the distribution in the scenario Distributions datasheet.
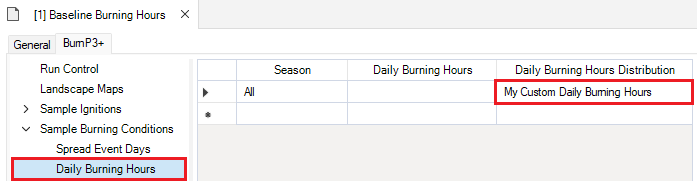
Then, assign the defined Distribution in the Daily Burning Hours Distribution column. In this case, the Season column must also be filled with season defined in the project Seasons datasheet. Ensure that the Daily Burning Hours, Daily Burning Hours SD, Daily Burning Hours Min, and Daily Burning Hours Max columns are empty.
3. How to set a built-in Statistical distribution
Users may choose between two built-in Statistical distributions: Normal or Gamma. Specify the distribution type in the Daily Burning Hours Distribution column by choosing one of the options from the dropdown menu, and set values for Daily Burning Hours (mean), and Daily Burning Hours SD (otherwise, both Daily Burning Hours, and Daily Burning Hours SD will default to 1). Optionally, users may specify values for Daily Burning Hours Min, and Daily Burning Hours Max to prevent extreme values.
Daily Weather
Datasheet internal name: burnP3Plus_WeatherStream
The Daily Weather datasheet can be found under the Sample Burning Conditions node and contains information about the daily weather conditions.
This datasheet is an input for the Sample Burning Conditions transformer.
This datasheet may be filled with the daily noon LSTh (local standard time) weather records from weather stations, and FWI (fire weather index) System fuel moisture codes, and fire behaviour indices.
If the user samples weather data sequentially for a multi-day fire that exceeds the number of daily weather rows (i.e., days), the simulation will repeat the last row of weather to fill out as many days as necessary.
Note: Daily Weather is a singular value that applies to each hour the fire burns on a particular day.
Order
Column internal name: Order
Defines the order in which to sample the weather records.
Data Type: Integer
Temperature
Column internal name: Temperature
Defines the daily noon temperature (°C).
Data Type: Double
Relative Humidity
Column internal name: RelativeHumidity
Defines the daily noon relative humidity (%).
Data Type: Double
Wind Speed
Column internal name: WindSpeed
Defines the daily noon wind speed (km/h).
Data Type: Double
Wind Direction
Column internal name: WindDirection
Defines the daily noon cardinal or intercardinal wind direction (° degrees). E.g., “0/360” corresponds to the cardinal direction North, “90.0” corresponds to the cardinal direction East, “180” corresponds to the cardinal direction South, and “270” corresponds to the cardinal direction West.
Data Type: Double
Precipitation
Column internal name: Precipitation
Defines the daily noon precipitation (mm).
Data Type: Double
Fine Fuel Moisture Code
Column internal name: FineFuelMoistureCode
Defines the Fine Fuel Moisture Code (FFMC). The FFMC represents the moisture content of fine surface fuels (e.g., litter and other cured fine fuels), and is indicative of the relative ease of ignition and flammability of fine fuels. The FFMC is calculated based on values for temperature, relative humidity, wind, and precipitation.
Although this code is unitless, it ranges from 0-101 wherein higher values indicate drier and more flammable fuels.
Data Type: Double
Duff Moisture Code
Column internal name: DuffMoistureCode
Defines the Duff Moisture Code (DMC). The DMC represents the average moisture content of loosely compacted organic layers of moderate depth below the surface, and is indicative of fuel consumption of moderate duff layers and medium-size woody material. The DMC is calculated based on values for temperature, relative humidity, and precipitation.
Although this code is unitless, it ranges from 0 to infinity wherein higher values are indicative of drier conditions.
Data Type: Double
Drought Code
Column internal name: DroughtCode
Defines the Drought Code (DC). The DC represents the moisture content of deep, compact organic layers, and is indicative of seasonal drought effects on forest fuels as well as the amount of smouldering in deep duff layers and large woody material (e.g., logs). The DC is calculated based on values for temperature, and precipitation.
Although this code is unitless, it ranges from 0 to infinity wherein higher values are indicative of long-term drying, and a greater potential for deeper burning.
Data Type: Double
Initial Spread Index
Column internal name: InitialSpreadIndex
Defines the Initial Spread Index (ISI). This index represents a numerical rating of the expected rate of fire spread based on wind speed, and the Fine Fuel Moisture Code (FFMC). The ISI does not account for fuel type; actual spread rates vary between fuel types at the same ISI.
Although this index is unitless, higher values represent faster spreading fires.
Data Type: Double
Build Up Index
Column internal name: BuildUpIndex
Defines the Build Up Index (BUI). This index represents the total fuel available for combustion based on the Duff Moisture Code (DMC), and Drought Code (DC).
Although this index is unitless, higher values represent greater fuel availability.
Data Type: Double
Fire Weather Index
Column internal name: FireWeatherIndex
Defines the Fire Weather Index (FWI). This index represents the overall fire intensity based on the Initial Spread Index (ISI) and Build Up Index (BUI). Generally, this index is indicative of fire danger within forested areas.
Data Type: Double
For more information on the Canadian Forest Fire Weather Index (FWI) System, visit this link.
Season
Column internal name: Season
Optional. Specifies the season for which this Daily Weather record should apply. Season may also be set to “All” to include this weather record, irrespective of the ignitions Season.
Seasons are defined in the project Seasons datasheet under the Advanced node.
Data Type: List Item
Weather Zone
Column internal name: WeatherZone
Optional. Specifies the weather zone for which this Daily Weather record should apply. Weather Zone may be left blank to include this record for ignitions in all Weather Zones. Internally, the value of this column is an integer referencing the ID of the corresponding Weather Zone name.
Weather Zones are defined in the project Weather Zones datasheet under the Advanced node.
Data Type: List Item
Weather Sampling Options
Datasheet internal name: burnP3Plus_WeatherOption
The Weather Sampling Options datasheet can be found under the Sample Burning Conditions node and contains information regarding how the weather data will be sampled.
Sample Weather Sequentially
Column internal name: SampleSequentially
Specifies if and how the daily weather data will be sampled for consecutive days of a multi-day fire. When sampling weather, available weather data will first be filtered by Season and Weather Zone of the current ignition.
If set to No, each day of burning will choose a random day of weather from the subset of relevant weather data.
If set to Yes, only the first day of burning will choose a random day of weather from the subset of relevant weather data. Assuming that the order of the daily weather records represents consecutive days, the remaining days of weather will be used in sequence associated with each day of burning.
Data Type: Boolean
Fire Growth Model Options
The Fire Growth transformers are responsible for simulating the spread of individual fires across a landscape using the deterministic inputs sampled by the previous two transformers. The BurnP3+ package does not include a Fire Growth transformer, but datasheets in this node are used to configure Fire Growth transformers in other packages, including BurnP3+Prometheus and BurnP3+FireSTARR.
Green Up
Datasheet internal name: burnP3Plus_GreenUp
A modifier of the Fire Behaviour Prediction (FBP) fuel types.
This datasheet is an input for the Prometheus and FireSTARR Fire Growth transformer.
Green Up
Column internal name: GreenUp
Green Up settings are used to configure certain fuels in the fire growth models. It is handled differently by different fire models but generally is used to determine how seasonal fuels (such as M1/M2 and D1/D2 in the FBP system) are treated.
Data Type: Boolean
Default: Yes
Season
Column internal name: Season
Specifies the season for which this Green Up record should apply. Use this option if Green Up changes across seasons. Seasons are defined in the project Seasons datasheet under the Advanced node.
Data Type: List Item
Curing
Datasheet internal name: burnP3Plus_Curing
A modifier of the Fire Behaviour Prediction (FBP) fuel types.
This datasheet is an input for the Prometheus and FireSTARR Fire Growth transformer.
Curing
Column internal name: Curing
Defines the percentage of grass that is dry. Grass moisture content impacts how grass fuel-types burn wherein higher values for curing represent drier grass that burns more easily.
Data Type: Integer
Default: 75
Season
Column internal name: Season
Specifies the season for which this Grass Curing record should apply. Use this option if Curing changes across seasons. Seasons are defined in the project Seasons datasheet under the Advanced node.
Data Type: List Item
Wind Grid
Datasheet internal name: burnP3Plus_WindGrid
Contains information about the cardinal and intercardinal wind directions, as well as prevailing wind speed.
Wind grids are used to describe how the landscape’s topography influences prevailing wind to produce more complex local wind patterns. Historically, Wind Grids have been generated using Wind Ninja.
This datasheet contains raster files (.tif) relevant to the associated study area. In SyncroSim Studio, the raster file can be selected by clicking on the yellow folder icon, removed by clicking on the trash can icon, and exported by clicking on export icon. If generating the model programmatically from R or Python, the value in this column should be the absolute path to the corresponding raster file.
This datasheet must specify a value for the prevailing wind speed, as well as include all cardinal and intercardinal wind speed and direction grids generated under the prevailing wind. Please note that in SyncroSim Studio, users may not exit this datasheet without filling in all the necessary entries.
Note: This datasheet is only used by the Prometheus Fire Growth transformer.
Prevailing Wind Speed
Column internal name: WindSpeed
Defines the prevailing wind speed (km/h) used to generate the wind grids.
Data Type: Double
Wind Speed North
Column internal name: WindSpeedNorth
A raster file (.tif) input that contains a grid of resulting wind speeds under a prevailing wind from the north.
Data Type: String
Wind Speed North East
Column internal name: WindSpeedNorthEast
A raster file (.tif) input that contains a grid of resulting wind speeds under a prevailing wind from the northeast.
Data Type: String
Wind Speed East
Column internal name: WindSpeedEast
A raster file (.tif) input that contains a grid of resulting wind speeds under a prevailing wind from the east.
Data Type: String
Wind Speed South East
Column internal name: WindSpeedSouthEast
A raster file (.tif) input that contains a grid of resulting wind speeds under a prevailing wind from the southeast.
Data Type: String
Wind Speed South
Column internal name: WindSpeedSouth
A raster file (.tif) input that contains a grid of resulting wind speeds under a prevailing wind from the south.
Data Type: String
Wind Speed South West
Column internal name: WindSpeedSouthWest
A raster file (.tif) input that contains a grid of resulting wind speeds under a prevailing wind from the southwest.
Data Type: String
Wind Speed West
Column internal name: WindSpeedWest
A raster file (.tif) input that contains a grid of resulting wind speeds under a prevailing wind from the west.
Data Type: String
Wind Speed North West
Column internal name: WindSpeedNorthWest
A raster file (.tif) input that contains a grid of resulting wind speeds under a prevailing wind from the northwest.
Data Type: String
Wind Direction North
Column internal name: WindDirectionNorth
A raster file (.tif) input that contains the resulting local wind direction under a prevailing wind from the north.
Data Type: String
Wind Direction North East
Column internal name: WindDirectionNorthEast
A raster file (.tif) input that contains the resulting local wind direction under a prevailing wind from the northeast .
Data Type: String
Wind Direction East
Column internal name: WindDirectionEast
A raster file (.tif) input that contains the resulting local wind direction under a prevailing wind from the east.
Data Type: String
Wind Direction South East
Column internal name: WindDirectionSouthEast
A raster file (.tif) input that contains the resulting local wind direction under a prevailing wind from the southeast.
Data Type: String
Wind Direction South
Column internal name: WindDirectionSouth
A raster file (.tif) input that contains the resulting local wind direction under a prevailing wind from the south.
Data Type: String
Wind Direction South West
Column internal name: WindDirectionSouthWest
A raster file (.tif) input that contains the resulting local wind direction under a prevailing wind from the southwest.
Data Type: String
Wind Direction West
Column internal name: WindDirectionWest
A raster file (.tif) input that contains the resulting local wind direction under a prevailing wind from the west.
Data Type: String
Wind Direction North West
Column internal name: WindDirectionNorthWest
A raster file (.tif) input that contains the resulting local wind direction under a prevailing wind from the northwest.
Data Type: String
Output Options
Tabular
Datasheet internal name: burnP3Plus_OutputOption
The Tabular datasheet can be found under the Output Options node and provides the option to generate a fire statistics table of simulation outputs.
Fire Statistics Table
Column internal name: FireStatistics
Determines whether to populate the fire statistics table. If set to Yes, an Output Fire Statistics Table will be populated. If set to No, the Output Fire Statistics Table will not be populated.
This datasheet is an input and output for the Summarize Burn Probability transformer.
Default: Yes
Data Type: Boolean
Spatial
Datasheet internal name: burnP3Plus_OutputOptionsSpatial
The Spatial datasheet can be found under the Output Options node and provides the option to select which spatial outputs to generate.
Burn Probability Map
Column internal name: BurnProbability
The absolute burn probability of each cell in the landscape summarized across all iterations. This value ranges from 0-1 and is calculated by dividing the number of iterations a cell burned in by the total number of iterations. Iterations that do not meet their sampled burn targets by way of resampling (see the Fire Resampling Options datasheet) are removed from the total number of iterations, and thus not included in the burn probability calculation.
If set to Yes a burn probability map will be created, and if set to No a burn probability map will not be created.
This datasheet is an output for the Summarize Burn Probability transformer. More specifically, the Burn Probability map is an intermediate output for the Relative Burn Probability map.
Output: one map per run
Default: Yes
Data Type: Boolean
Seasonal Burn Probability Map
Column internal name: SeasonalBurnProbability
The absolute burn probability of each cell in the landscape summarized across all iterations, stratified by season. This value ranges from 0-1 and is calculated by dividing the number of iterations a cell burned in by the total number of iterations. Iterations that do not meet their sampled burn targets by way of resampling (see the Fire Resampling Options datasheet) are removed from the total number of iterations, and thus not included in the burn probability calculation.
If set to Yes a seasonal burn probability map will be created, and if set to No a seasonal burn probability map will not be created.
This datasheet is an output for the Summarize Burn Probability transformer. More specifically, the Seasonal Burn Probability map is an intermediate output for the Seasonal Relative Burn Probability map.
Output: one map per run and season
Default: Yes
Data Type: Boolean
Relative Burn Probability Map
Column internal name: RelativeBurnProbability
The burn probability of each cell relative (on a linear scale) to the average burn probability of all cells in the landscape summarized across all iterations.
For instance: a relative burn probability of 1 means it is just as likely to burn as the average, a relative burn probability of 2 means it’s 2 times more likely to burn, a relative burn probability of 3 means it’s 3 times more likely to burn, and so on. If a cell is less likely to burn compared to the average, the negative reciprocal of the probability over the average is used. For instance, a relative burn probability of -2 means it’s half as likely to burn compared to the average cell, a relative burn probability of -3 means it’s 1/3rd as likely to burn, and so on.
Values are discrete integers and a relative burn probability of zero is not possible. Any values above 10, and below -10 are truncated to 11 and -11, respectively.
If set to Yes a relative burn probability map will be created, and if set to No a relative burn probability map will not be created.
This datasheet is an output for the Summarize Burn Probability transformer.
Output: one map per run
Default: Yes
Data Type: Boolean
Seasonal Relative Burn Probability Map
Column internal name: SeasonalRelativeBurnProbability
The burn probability of each cell relative (on a linear scale) to the average burn probability of all cells in the landscape summarized across all iterations, stratified by season.
For instance: a relative burn probability of 1 means it is just as likely to burn as the average, a relative burn probability of 2 means it’s 2 times more likely to burn, a relative burn probability of 3 means it’s 3 times more likely to burn, and so on. If a cell is less likely to burn compared to the average, the negative reciprocal of the probability over the average is used. For instance, a relative burn probability of -2 means it’s half as likely to burn compared to the average cell, a relative burn probability of -3 means it’s 1/3rd as likely to burn, and so on.
Values are discrete integers and a relative burn probability of zero is not possible. Any values above 10, and below -10 are truncated to 11 and -11, respectively.
If set to Yes a seasonal relative burn probability map will be created, and if set to No a relative seasonal burn probability map will not be created.
This datasheet is an output for the Summarize Burn Probability transformer.
Output: one map per run per season
Default: Yes
Data Type: Boolean
Burn Count Map
Column internal name: BurnCount
The number of times a cell burned across all iterations. This is an intermediate output to Burn Probability. If the Burn Probability Map output is chosen, but not the Burn Count Map, the Burn Count Maps will still be generated during the model run but will then be purged on run completion. Iterations that do not meet their sampled burn targets by way of resampling (see the Fire Resampling Options datasheet) are removed from the total number of iterations, and thus not included in the burn count.
If set to Yes a burn count map will be created, and if set to No a burn count map will not be created.
This datasheet is an output for the Summarize Burn Probability transformer.
Output: one map per run
Default: Yes
Data Type: Boolean
Seasonal Burn Count Map
Column internal name: SeasonalBurnCount
The number of times a cell burned across all iterations, stratified by season. This is an intermediate output to Seasonal Burn Probability. If the Seasonal Burn Probability Map output is chosen, but not the Seasonal Burn Count Map, the Seasonal Burn Count Maps will still be generated during the model run but will then be purged on run completion. Iterations that do not meet their sampled burn targets by way of resampling (see the Fire Resampling Options datasheet) are removed from the total number of iterations, and thus not included in the burn count.
Note: the sum of all seasonal burn maps (except All) is always the same or greater than the non-seasonal burn count. This is because a single cell can be burned by multiple fires in different seasons, but a single iteration. In this case, burn count maps would count the burn(s) independently, but the non-seasonal burn count would only count the burn once.
If set to Yes a seasonal burn count map will be created, and if set to No a seasonal burn count map will not be created.
This datasheet is an output for the Summarize Burn Probability transformer.
Output: one map per run per season
Default: Yes
Data Type: Boolean
Burn Maps
Column internal name: BurnMap
Describes whether or not a cell burned per iteration. Values are 1 (yes, the cell burned in any fire within the iteration), 0 (no, the cell did not burn in any fire within the iteration), or NA (the cell is masked out by the fuel map). Fires that do not meet the minimum fire size are not included in the burn map.
If set to Yes a burn map will be created, and if set to No a burn map will not be created.
This datasheet is an output for the Summarize Burn Probability transformer.
Output: one map per iteration
Default: Yes
Data Type: Boolean
Seasonal Burn Maps
Column internal name: SeasonalBurnMap
Describes whether or not a cell burned per iteration, stratified by season. Values are 1 (yes, the cell burned in any fire within the iteration), 0 (no, the cell did not burn in any fire within the iteration), or NA (the cell is masked out by the fuel map). Fires that do not meet the minimum fire size are not included in the burn map.
If set to Yes a seasonal burn map will be created, and if set to No a seasonal burn map will not be created.
This datasheet is an output for the Summarize Burn Probability transformer.
Output: one map per iteration per season
Default: Yes
Data Type: Boolean
Burn Perimeters
Column internal name: BurnPerimeter
Shapefiles containing the final burn perimeters for each fire across all iterations.
If set to Yes shapefiles will be created, and if set to No shapefiles will not be created.
This datasheet is an output for the Summarize Burn Probability transformer.
Output: one map per fire
Default: Yes
Data Type: Boolean
Output Individual Burn Maps
Column internal name: AllPerim
Raster of the burned area for each fire within each iteration. Values are 1 (yes, the cell burned in any fire), 0 (no, the cell did not burn in any fire), or NA (the cell is masked out by the fuel map).
If set to Yes an individual fire burn perimeter map will be created, and if set to No an individual fire burn perimeter map will not be created.
This datasheet is an output for the Summarize Burn Probability transformer.
Output: one map per iteration
Default: Yes
Data Type: Boolean
Spatial FBP
Datasheet internal name: burnP3Plus_OutputOptionFBPSpatial
The Spatial FBP datasheet can be found under the Output Options node and provides the option to select which Fire Behaviour Prediction (FBP) System spatial outputs to generate. Each FBP output variable is added as a row in this datasheet, along with the summary statistics and per-fire maps to generate for that variable.
Variable
Column internal name: Variable
Specifies the FBP output variable for which maps will be generated. The available variables are:
- Rate of Spread Map — describes the predicted speed (m/min) of fire as it initially passes through the cell. The Rate of Spread (ROS) metric is based on the Fuel Type, Initial Spread Index (ISI), Buildup Index (BUI), and other fuel-specific parameters (i.e., leafless or green in deciduous trees, crown base height in coniferous trees, and percent curing in grasses).
- Fire Intensity Map — describes the predicted intensity (energy output in kW/m) of the fire as it initially passes through the cell. The Fire Intensity (FI) metric is based on the Rate of Spread (ROS), and the Total Fuel Consumption (TFC).
- Spread Direction Map — describes the predicted direction of fire spread.
- Surface Fuel Consumption Map — describes the predicted amount (kg/m2) of fuel consumed by the fire on the surface of the forest floor.
- Crown Fraction Burned Map — describes the predicted fraction (%) of tree crowns burned by the fire. The Crown Fraction Burned (BUI) is based on the Buildup Index (BUI), foliar moisture content, surface fuel consumption, and Rate of Spread (ROS).
- Crown Fraction Consumed Map — describes the predicted fraction (%) of tree crowns consumed by the fire.
- Total Fuel Consumption Map — describes the predicted amount (kg/m2) of fuel consumed by the fire on the forest floor and in the crown. The Total Fuel Consumption (TFC) is based on foliar moisture content, surface fuel consumption, and Rate of Spread (ROS).
Data Type: List Item
For more information visit the FBP system webpage.
Average
Column internal name: Average
If set to Yes, a map of the average value of the selected variable across all simulated fires will be created.
Data Type: Boolean
Minimum
Column internal name: Minimum
If set to Yes, a map of the minimum value of the selected variable across all simulated fires will be created.
Data Type: Boolean
Maximum
Column internal name: Maximum
If set to Yes, a map of the maximum value of the selected variable across all simulated fires will be created.
Data Type: Boolean
Median
Column internal name: Median
If set to Yes, a map of the median value of the selected variable across all simulated fires will be created.
Data Type: Boolean
Percentile 1
Column internal name: Percentile1
Optionally specifies a percentile (between 0 and 100) of the selected variable across all simulated fires for which a summary map will be created. Up to three percentiles can be specified per variable.
Data Type: Double
Percentile 2
Column internal name: Percentile2
Optionally specifies a percentile (between 0 and 100) of the selected variable across all simulated fires for which a summary map will be created. Up to three percentiles can be specified per variable.
Data Type: Double
Percentile 3
Column internal name: Percentile3
Optionally specifies a percentile (between 0 and 100) of the selected variable across all simulated fires for which a summary map will be created. Up to three percentiles can be specified per variable.
Data Type: Double
Per-Fire Maps
Column internal name: Individual
If set to Yes, an individual map of the selected variable will be created for each simulated fire.
Data Type: Boolean
Output Rate of Spread Map
Datasheet internal name: burnP3Plus_OutputRateOfSpreadMap
The Output Rate of Spread Map datasheet contains the per-fire rate of spread maps created when Per-Fire Maps is selected for the Rate of Spread Map variable in the Spatial FBP datasheet.
Iteration
Column internal name: Iteration
Specifies the map’s iteration.
Data Type: Integer
Timestep
Column internal name: Timestep
Specifies the map’s timestep.
Data Type: Integer
FireID
Column internal name: FireID
Specifies the map’s fire ID.
Data Type: Integer
FileName
Column internal name: FileName
Specifies the map’s file name.
Data Type: String
Band
Column internal name: Band
Specifies the map’s band.
Data Type: Integer
Output Rate of Spread Summary Map
Datasheet internal name: burnP3Plus_OutputRateOfSpreadSummaryMap
The Output Rate of Spread Summary Map datasheet contains the rate of spread summary maps created for each summary statistic selected for the Rate of Spread Map variable in the Spatial FBP datasheet.
Summary
Column internal name: Summary
Specifies the summary statistic associated with the map (Average, Minimum, Maximum, Median, or a percentile).
Data Type: List Item
Iteration
Column internal name: Iteration
Specifies the map’s iteration.
Data Type: Integer
Timestep
Column internal name: Timestep
Specifies the map’s timestep.
Data Type: Integer
FileName
Column internal name: FileName
Specifies the map’s file name.
Data Type: String
Band
Column internal name: Band
Specifies the map’s band.
Data Type: Integer
Output Fire Intensity Map
Datasheet internal name: burnP3Plus_OutputFireIntensityMap
The Output Fire Intensity Map datasheet contains the per-fire fire intensity maps created when Per-Fire Maps is selected for the Fire Intensity Map variable in the Spatial FBP datasheet.
Iteration
Column internal name: Iteration
Specifies the map’s iteration.
Data Type: Integer
Timestep
Column internal name: Timestep
Specifies the map’s timestep.
Data Type: Integer
FireID
Column internal name: FireID
Specifies the map’s fire ID.
Data Type: Integer
FileName
Column internal name: FileName
Specifies the map’s file name.
Data Type: String
Band
Column internal name: Band
Specifies the map’s band.
Data Type: Integer
Output Fire Intensity Summary Map
Datasheet internal name: burnP3Plus_OutputFireIntensitySummaryMap
The Output Fire Intensity Summary Map datasheet contains the fire intensity summary maps created for each summary statistic selected for the Fire Intensity Map variable in the Spatial FBP datasheet.
Summary
Column internal name: Summary
Specifies the summary statistic associated with the map (Average, Minimum, Maximum, Median, or a percentile).
Data Type: List Item
Iteration
Column internal name: Iteration
Specifies the map’s iteration.
Data Type: Integer
Timestep
Column internal name: Timestep
Specifies the map’s timestep.
Data Type: Integer
FileName
Column internal name: FileName
Specifies the map’s file name.
Data Type: String
Band
Column internal name: Band
Specifies the map’s band.
Data Type: Integer
Output Spread Direction Map
Datasheet internal name: burnP3Plus_OutputSpreadDirectionMap
The Output Spread Direction Map datasheet contains the per-fire spread direction maps created when Per-Fire Maps is selected for the Spread Direction Map variable in the Spatial FBP datasheet.
Iteration
Column internal name: Iteration
Specifies the map’s iteration.
Data Type: Integer
Timestep
Column internal name: Timestep
Specifies the map’s timestep.
Data Type: Integer
FireID
Column internal name: FireID
Specifies the map’s fire ID.
Data Type: Integer
FileName
Column internal name: FileName
Specifies the map’s file name.
Data Type: String
Band
Column internal name: Band
Specifies the map’s band.
Data Type: Integer
Output Spread Direction Summary Map
Datasheet internal name: burnP3Plus_OutputSpreadDirectionSummaryMap
The Output Spread Direction Summary Map datasheet contains the spread direction summary maps created for each summary statistic selected for the Spread Direction Map variable in the Spatial FBP datasheet.
Summary
Column internal name: Summary
Specifies the summary statistic associated with the map (Average, Minimum, Maximum, Median, or a percentile).
Data Type: List Item
Iteration
Column internal name: Iteration
Specifies the map’s iteration.
Data Type: Integer
Timestep
Column internal name: Timestep
Specifies the map’s timestep.
Data Type: Integer
FileName
Column internal name: FileName
Specifies the map’s file name.
Data Type: String
Band
Column internal name: Band
Specifies the map’s band.
Data Type: Integer
Output Surface Fuel Consumption Map
Datasheet internal name: burnP3Plus_OutputSurfaceFuelConsumptionMap
The Output Surface Fuel Consumption Map datasheet contains the per-fire surface fuel consumption maps created when Per-Fire Maps is selected for the Surface Fuel Consumption Map variable in the Spatial FBP datasheet.
Iteration
Column internal name: Iteration
Specifies the map’s iteration.
Data Type: Integer
Timestep
Column internal name: Timestep
Specifies the map’s timestep.
Data Type: Integer
FireID
Column internal name: FireID
Specifies the map’s fire ID.
Data Type: Integer
FileName
Column internal name: FileName
Specifies the map’s file name.
Data Type: String
Band
Column internal name: Band
Specifies the map’s band.
Data Type: Integer
Output Surface Fuel Consumption Summary Map
Datasheet internal name: burnP3Plus_OutputSurfaceFuelConsumptionSummaryMap
The Output Surface Fuel Consumption Summary Map datasheet contains the surface fuel consumption summary maps created for each summary statistic selected for the Surface Fuel Consumption Map variable in the Spatial FBP datasheet.
Summary
Column internal name: Summary
Specifies the summary statistic associated with the map (Average, Minimum, Maximum, Median, or a percentile).
Data Type: List Item
Iteration
Column internal name: Iteration
Specifies the map’s iteration.
Data Type: Integer
Timestep
Column internal name: Timestep
Specifies the map’s timestep.
Data Type: Integer
FileName
Column internal name: FileName
Specifies the map’s file name.
Data Type: String
Band
Column internal name: Band
Specifies the map’s band.
Data Type: Integer
Output Crown Fraction Burned Map
Datasheet internal name: burnP3Plus_OutputCrownFractionBurnedMap
The Output Crown Fraction Burned Map datasheet contains the per-fire crown fraction burned maps created when Per-Fire Maps is selected for the Crown Fraction Burned Map variable in the Spatial FBP datasheet.
Iteration
Column internal name: Iteration
Specifies the map’s iteration.
Data Type: Integer
Timestep
Column internal name: Timestep
Specifies the map’s timestep.
Data Type: Integer
FireID
Column internal name: FireID
Specifies the map’s fire ID.
Data Type: Integer
FileName
Column internal name: FileName
Specifies the map’s file name.
Data Type: String
Band
Column internal name: Band
Specifies the map’s band.
Data Type: Integer
Output Crown Fraction Burned Summary Map
Datasheet internal name: burnP3Plus_OutputCrownFractionBurnedSummaryMap
The Output Crown Fraction Burned Summary Map datasheet contains the crown fraction burned summary maps created for each summary statistic selected for the Crown Fraction Burned Map variable in the Spatial FBP datasheet.
Summary
Column internal name: Summary
Specifies the summary statistic associated with the map (Average, Minimum, Maximum, Median, or a percentile).
Data Type: List Item
Iteration
Column internal name: Iteration
Specifies the map’s iteration.
Data Type: Integer
Timestep
Column internal name: Timestep
Specifies the map’s timestep.
Data Type: Integer
FileName
Column internal name: FileName
Specifies the map’s file name.
Data Type: String
Band
Column internal name: Band
Specifies the map’s band.
Data Type: Integer
Output Crown Fraction Consumed Map
Datasheet internal name: burnP3Plus_OutputCrownFractionConsumedMap
The Output Crown Fraction Consumed Map datasheet contains the per-fire crown fraction consumed maps created when Per-Fire Maps is selected for the Crown Fraction Consumed Map variable in the Spatial FBP datasheet.
Iteration
Column internal name: Iteration
Specifies the map’s iteration.
Data Type: Integer
Timestep
Column internal name: Timestep
Specifies the map’s timestep.
Data Type: Integer
FireID
Column internal name: FireID
Specifies the map’s fire ID.
Data Type: Integer
FileName
Column internal name: FileName
Specifies the map’s file name.
Data Type: String
Band
Column internal name: Band
Specifies the map’s band.
Data Type: Integer
Output Crown Fraction Consumed Summary Map
Datasheet internal name: burnP3Plus_OutputCrownFractionConsumedSummaryMap
The Output Crown Fraction Consumed Summary Map datasheet contains the crown fraction consumed summary maps created for each summary statistic selected for the Crown Fraction Consumed Map variable in the Spatial FBP datasheet.
Summary
Column internal name: Summary
Specifies the summary statistic associated with the map (Average, Minimum, Maximum, Median, or a percentile).
Data Type: List Item
Iteration
Column internal name: Iteration
Specifies the map’s iteration.
Data Type: Integer
Timestep
Column internal name: Timestep
Specifies the map’s timestep.
Data Type: Integer
FileName
Column internal name: FileName
Specifies the map’s file name.
Data Type: String
Band
Column internal name: Band
Specifies the map’s band.
Data Type: Integer
Output Total Fuel Consumption Map
Datasheet internal name: burnP3Plus_OutputTotalFuelConsumptionMap
The Output Total Fuel Consumption Map datasheet contains the per-fire total fuel consumption maps created when Per-Fire Maps is selected for the Total Fuel Consumption Map variable in the Spatial FBP datasheet.
Iteration
Column internal name: Iteration
Specifies the map’s iteration.
Data Type: Integer
Timestep
Column internal name: Timestep
Specifies the map’s timestep.
Data Type: Integer
FireID
Column internal name: FireID
Specifies the map’s fire ID.
Data Type: Integer
FileName
Column internal name: FileName
Specifies the map’s file name.
Data Type: String
Band
Column internal name: Band
Specifies the map’s band.
Data Type: Integer
Output Total Fuel Consumption Summary Map
Datasheet internal name: burnP3Plus_OutputTotalFuelConsumptionSummaryMap
The Output Total Fuel Consumption Summary Map datasheet contains the total fuel consumption summary maps created for each summary statistic selected for the Total Fuel Consumption Map variable in the Spatial FBP datasheet.
Summary
Column internal name: Summary
Specifies the summary statistic associated with the map (Average, Minimum, Maximum, Median, or a percentile).
Data Type: List Item
Iteration
Column internal name: Iteration
Specifies the map’s iteration.
Data Type: Integer
Timestep
Column internal name: Timestep
Specifies the map’s timestep.
Data Type: Integer
FileName
Column internal name: FileName
Specifies the map’s file name.
Data Type: String
Band
Column internal name: Band
Specifies the map’s band.
Data Type: Integer
Advanced
Deterministic Ignition Location and Deterministic Burn Conditions are automatically populated from the first two BurnP3+ transformers (i.e., 1 – Sample Ignitions, and 2 – Sample Burning Conditions). However, users may populate these tables with their own data instead of sampling them with these transformers when creating a deterministic model (e.g., when modeling historical fires, etc.).
Deterministic Ignition Location
Datasheet internal name: burnP3Plus_DeterministicIgnitionLocation
The Deterministic Ignition Location datasheet can be found under the Advanced node and provides information on the ignition locations in the simulation.
This datasheet is usually populated by the Sample Ignitions transformer but can be filled by hand for deterministic runs.
Note: Each row in this datasheet corresponds to a single iteration.
Iteration
Column internal name: Iteration
Specifies the iteration.
Data Type: Integer
Fire ID
Column internal name: FireID
Specifies the Fire ID.
Data Type: Integer
Latitude
Column internal name: Latitude
Specifies the fire location’s latitude in degrees following EPSG:4326.
Note: The CRS of the input rasters are not taken into consideration here.
Data Type: Double
Longitude
Column internal name: Longitude
Specifies the fire location’s longitude in degrees following EPSG:4326.
Note: The CRS of the input rasters are not taken into consideration here.
Data Type: Double
Season
Column internal name: Season
Specifies the fire season.
Seasons are defined in the project Seasons datasheet under the Advanced node.
Data Type: List Item
Cause
Column internal name: Cause
Specifies the fire cause.
Causes are defined in the project Causes datasheet under the Advanced node.
Data Type: List Item
Deterministic Burn Conditions
Datasheet internal name: burnP3Plus_DeterministicBurnCondition
The Deterministic Burn Conditions datasheet can be found under the Advanced node and provides information on the burn conditions experienced by each ignition for each day of burning.
This is usually populated by the Sample Burning Conditions transformer but can be filled by hand for deterministic runs.
Iteration
Column internal name: Iteration
Specifies the iteration.
Data Type: Integer
Fire ID
Column internal name: FireID
Specifies the Fire ID.
Data Type: Integer
Burn Day
Column internal name: BurnDay
Specifies which day of a multi-day fire the weather in this row corresponds to.
Data Type: Integer
Hours Burning
Column internal name: HoursBurning
Specifies the number of hours of active fire spread on the specific Burn Day.
Data Type: Integer
Temperature
Column internal name: Temperature
Specifies the temperature (°C) the fire will be modeled under on the specific Burn Day.
Data Type: Double
Relative Humidity
Column internal name: RelativeHumidity
Specifies the relative humidity (%) the fire will be modeled under on the specific Burn Day.
Data Type: Double
Wind Speed
Column internal name: WindSpeed
Specifies the wind speed (km/h) the fire will be modeled under on the specific Burn Day.
Data Type: Double
Wind Direction
Column internal name: WindDirection
Specifies the wind direction the fire will be modeled under on the specific Burn Day.
Data Type: Double
Precipitation
Column internal name: Precipitation
Specifies the precipitation (mm) the fire will be modeled under on the specific Burn Day .
Data Type: Double
Fine Fuel Moisture Code
Column internal name: FineFuelMoistureCode
Defines the Fine Fuel Moisture Code (FFMC) the fire will be modeled under on the specific Burn Day. The FFMC represents the moisture content of fine surface fuels (e.g., litter and other cured fine fuels), and is indicative of the relative ease of ignition and flammability of fine fuels. The FFMC is calculated based on values for temperature, relative humidity, wind, and precipitation.
Although this code is unitless, it ranges from 0-101 wherein higher values indicate drier and more flammable fuels.
Data Type: Double
Duff Moisture Code
Column internal name: DuffMoistureCode
Defines the Duff Moisture Code (DMC) the fire will be modeled under on the specific Burn Day. The DMC represents the average moisture content of loosely compacted organic layers of moderate depth below the surface, and is indicative of fuel consumption of moderate duff layers and medium-size woody material. The DMC is calculated based on values for temperature, relative humidity, and precipitation.
Although this code is unitless, it ranges from 0 to infinity wherein higher values are indicative of drier conditions.
Data Type: Double
Drought Code
Column internal name: DroughtCode
Defines the Drought Code (DC) the fire will be modeled under on the specific Burn Day. The DC represents the moisture content of deep, compact organic layers, and is indicative of seasonal drought effects on forest fuels as well as the amount of smouldering in deep duff layers and large woody material (e.g., logs). The DC is calculated based on values for temperature, and precipitation.
Although this code is unitless, it ranges from 0 to infinity wherein higher values are indicative of long-term drying, and a greater potential for deeper burning.
Data Type: Double
Initial Spread Index
Column internal name: InitialSpreadIndex
Defines the Initial Spread Index (ISI) the fire will be modeled under on the specific Burn Day. This index represents a numerical rating of the expected rate of fire spread based on wind speed, and the Fine Fuel Moisture Code (FFMC). The ISI does not account for fuel type; actual spread rates vary between fuel types at the same ISI.
Although this index is unitless, higher values represent faster spreading fires.
Data Type: Double
Build Up Index
Column internal name: BuildUpIndex
Defines the Build Up Index (BUI) the fire will be modeled under on the specific Burn Day. This index represents the total fuel available for combustion based on the Duff Moisture Code (DMC), and Drought Code (DC).
Although this index is unitless, higher values represent greater fuel availability.
Data Type: Double
Fire Weather Index
Column internal name: FireWeatherIndex
Defines the Fire Weather Index (FWI) the fire will be modeled under on the specific Burn Day. This index represents the overall fire intensity based on the Initial Spread Index (ISI) and Build Up Index (BUI). Generally, this index is indicative of fire danger within forested areas.
Data Type: Double
For more information on the Canadian Forest Fire Weather Index (FWI) System, visit this link.
Fire Resampling Options
Datasheet internal name: burnP3Plus_FireResampleOption
The Fire Resampling Options datasheet can be found under the Advanced node and provides specifications on the minimum fire size, and the proportion of extra ignitions to sample for replacing fires below the minimum fire size in the simulation.
This datasheet is an input for the Sample Ignitions and Fire Growth transformers.
Minimum Fire Size (ha)
Column internal name: MinimumFireSize
Specifies the minimum fire size in hectares. All fires that do not exceed the minimum size threshold will be discarded from the analysis.
Default: 0
Data Type: Double
Proportion of Extra Ignitions to Sample for Replacing Fires below Minimum Size
Column internal name: ProportionExtraIgnition
Specifies the number of extra ignitions to be generated to make up for discarded fires (i.e., any fires that fall below the minimum fire size). E.g., “0.1” means that an extra 10% (rounded up) of ignitions are generated. Values above 1 are accepted but likely represents sampling far more extra ignitions than necessary.
Default: 0
Data Type: Double
Distributions
Datasheet internal name: core_DistributionValue
The Distributions datasheet can be found under the Advanced node and provides information on any user defined distributions.
Name
Column internal name: Name
Specifies the name of the distribution.
Data Type: List Item
Value
Column internal name: Value
Defines a value in the distribution.
Data Type: Double
Relative Frequency
Column internal name: RelativeFrequency
Defines the relative frequency of the specified value in the distribution.
Data Type: Double
Distribution Examples
1. Adding Distributions
An example of the Distribution datasheet in the BurnP3+Prometheus template library’s Baseline Conditions scenario outlining Hours Burning and Spread Event Days distributions.
Output Fire Statistics Table
Datasheet internal name: burnP3Plus_OutputFireStatistic
The OutputFireStatistic datasheet can be found under the Advanced node and provides a tabular summary of the fires burned in the simulation. This table is populated by the Fire Growth transformers and can be modified by the Summary transformer during resampling.
Iteration
Column internal name: Iteration
Defines the iteration number.
Data Type: Integer
Fire ID
Column internal name: FireID
Defines the fire ID, where each Fire ID represents a single fire on the landscape.
Note: Each Fire ID is only unique in conjunction with the iteration. This means that the first fire of every iteration is assigned a Fire ID of 1.
Data Type: Integer
Latitude
Column internal name: Latitude
Defines the latitude of the fire’s ignition point in degrees following EPSG:4326
Note: The CRS of the input rasters are not taken into consideration here.
Data Type: Double
Longitude
Column internal name: Longitude
Defines the longitude of the fire’s ignition point in degrees following EPSG:4326.
Note: The CRS of the input rasters are not taken into consideration here.
Data Type: Double
Fuel Type
Column internal name: FuelType
Defines the fuel type in which a fire ignited.
Fuel Types are defined in the project Fuel Type datasheet under the Advanced node.
Data Type: List Item
For more information on the Canadian Fire Behaviour Prediction (FBP) System fuel type descriptions, visit this link.
Fire Duration
Column internal name: FireDuration
Defines how many days of active fire spread occurred.
Data Type: Integer
Hours Burning
Column internal name: HoursBurning
Defines how many hours of active fire spread occurred over the total duration of the fire.
Data Type: Integer
Area
Column internal name: Area
Defines the area of a fire in hectares.
Data Type: Double
Resample Status
Column internal name: ResampleStatus
Specifies if the fire was resampled. This column may contain one of five possible values based on the specifications set in the Fire Resampling Options datasheet:
i. Kept – indicates fires that were above the minimum fire size and retained in the spatial outputs.
ii. Discarded – indicates fires that were below the minimum fire size and discarded from the spatial outputs.
iii. Reassigned – indicates extra fires that were reassigned to replace fires that were discarded (i.e., below the minimum fire size). Reassigned fires are also associated with a specific Iteration number and Fire ID, which indicate where the fire was relocated.
iv. Not Used – indicates extra fires that were not needed to replace discarded fires.
v. Extra – indicates all extra fires sampled by the Sample Ignitions transformer and burned by the Fire Growth transformer. All Extra fires are later classified as either Reassigned or Not Used by the Summary transformer.
Data Type: String
Season
Column internal name: Season
Defines the season.
Seasons are defined in the project Seasons datasheet under the Advanced node.
Data Type: List Item
Cause
Column internal name: Cause
Defines the cause of the fire event. Internally, the value of this column is an integer referencing the ID of the corresponding Cause name.
Causes are defined in the project Causes datasheet under the Advanced node.
Data Type: List Item
Fire Zone
Column internal name: FireZone
Defines the fire zone in which a fire ignited.
Fire Zones are defined in the project Fire Zone datasheet under the Advanced node.
Data Type: List Item
Weather Zone
Column internal name: WeatherZone
Defines the weather zone in which a fire ignited.
Weather Zones are defined in the project Weather Zones datasheet under the Advanced node.
Data Type: List Item
Output Burn Probability
Datasheet internal name: burnP3Plus_OutputBurnProbability
The Output Burn Probability datasheet contains the burn probability map(s) created when Burn Probability Map or Seasonal Burn Probability Map is selected in the Spatial datasheet. The burn probability of a cell is calculated by dividing the number of iterations in which it burned by the total number of iterations.
This datasheet is an output for the Summarize Burn Probability transformer.
Iteration
Column internal name: Iteration
Specifies the map’s iteration.
Data Type: Integer
Timestep
Column internal name: Timestep
Specifies the map’s timestep.
Data Type: Integer
Season
Column internal name: Season
Optional. Specifies the season associated with the map, if the Seasonal Burn Probability Map option was selected in the Spatial datasheet.
Seasons are defined in the project Seasons datasheet under the Advanced node.
Data Type: List Item
Burn Probability Map
Column internal name: FileName
Specifies the map’s file name.
Data Type: String
Band
Column internal name: Band
Optional. Specifies the map’s band.
Data Type: Integer
Output Relative Burn Probability
Datasheet internal name: burnP3Plus_OutputRelativeBurnProbability
The Output Relative Burn Probability datasheet contains the relative burn probability map(s) created when Relative Burn Probability Map or Seasonal Relative Burn Probability Map is selected in the Spatial datasheet. Relative burn probability expresses the burn probability of a cell relative (on a linear scale) to the average burn probability of all cells in the landscape.
This datasheet is an output for the Summarize Burn Probability transformer.
Iteration
Column internal name: Iteration
Specifies the map’s iteration.
Data Type: Integer
Timestep
Column internal name: Timestep
Specifies the map’s timestep.
Data Type: Integer
Season
Column internal name: Season
Optional. Specifies the season associated with the map, if the Seasonal Relative Burn Probability Map option was selected in the Spatial datasheet.
Seasons are defined in the project Seasons datasheet under the Advanced node.
Data Type: List Item
Relative Burn Probability Map
Column internal name: FileName
Specifies the map’s file name.
Data Type: String
Band
Column internal name: Band
Optional. Specifies the map’s band.
Data Type: Integer
Output Burn Count
Datasheet internal name: burnP3Plus_OutputBurnCount
The Output Burn Count datasheet contains the burn count map(s) created when Burn Count Map or Seasonal Burn Count Map is selected in the Spatial datasheet. Each cell records the number of times it burned across all iterations. This is an intermediate output to Burn Probability.
This datasheet is an output for the Summarize Burn Probability transformer.
Iteration
Column internal name: Iteration
Specifies the map’s iteration.
Data Type: Integer
Timestep
Column internal name: Timestep
Specifies the map’s timestep.
Data Type: Integer
Season
Column internal name: Season
Optional. Specifies the season associated with the map, if the Seasonal Burn Count Map option was selected in the Spatial datasheet.
Seasons are defined in the project Seasons datasheet under the Advanced node.
Data Type: List Item
Burn Count Map
Column internal name: FileName
Specifies the map’s file name.
Data Type: String
Band
Column internal name: Band
Optional. Specifies the map’s band.
Data Type: Integer
Output Burn Map
Datasheet internal name: burnP3Plus_OutputBurnMap
The Output Burn Map datasheet contains the burn map(s) created when Burn Maps or Seasonal Burn Maps is selected in the Spatial datasheet. Each cell describes whether or not it burned in a given iteration. Values are 1 (yes, the cell burned in any fire within the iteration), 0 (no, the cell did not burn in any fire within the iteration), or NA (the cell is masked out by the fuel map).
This datasheet is an output for the Summarize Burn Probability transformer.
Iteration
Column internal name: Iteration
Specifies the map’s iteration.
Data Type: Integer
Timestep
Column internal name: Timestep
Specifies the map’s timestep.
Data Type: Integer
Season
Column internal name: Season
Optional. Specifies the season associated with the map, if the Seasonal Burn Maps option was selected in the Spatial datasheet.
Seasons are defined in the project Seasons datasheet under the Advanced node.
Data Type: List Item
Burn Map
Column internal name: FileName
Specifies the map’s file name.
Data Type: String
Band
Column internal name: Band
Optional. Specifies the map’s band.
Data Type: Integer
Output Fire Perimeters
Datasheet internal name: burnP3Plus_OutputFirePerimeter
The Output Fire Perimeters datasheet contains the GeoPackage file(s) of fire perimeters created when Burn Perimeters is set to Final or Daily in the Spatial datasheet.
This datasheet is an output for the Merge Fire Growth Scenarios and Summarize Burn Probability transformers.
Burn Perimeter
Column internal name: FileName
Specifies the file name of the GeoPackage (.gpkg) containing the fire perimeter(s).
Data Type: String
Description
Column internal name: Description
Optional. Provides a description of the fire perimeter output.
Data Type: String
Output Individual Burn Maps
Datasheet internal name: burnP3Plus_OutputAllPerim
The Output Individual Burn Maps datasheet contains the raster(s) of the burned area for each fire created when Output Individual Burn Maps is selected in the Spatial datasheet. Values are 1 (yes, the cell burned in this fire), 0 (no, the cell did not burn in this fire), or NA (the cell is masked out by the fuel map).
This datasheet is an output for the Summarize Burn Probability transformer.
Iteration
Column internal name: Iteration
Specifies the map’s iteration.
Data Type: Integer
Fire ID
Column internal name: FireID
Specifies the map’s fire ID.
Data Type: Integer
Timestep
Column internal name: Timestep
Specifies the map’s timestep.
Data Type: Integer
Burn Map
Column internal name: FileName
Specifies the map’s file name.
Data Type: String
Band
Column internal name: Band
Optional. Specifies the map’s band.
Data Type: Integer
Output Burn Tables
Datasheet internal name: burnP3Plus_OutputRawTabular
The Output Burn Tables datasheet contains the raw tabular burn record(s) (Parquet format) generated by the fire growth models. These tables are used internally to compute the burn probability, burn count, burn map, and related spatial outputs.
This datasheet is an output for the Merge Fire Growth Scenarios and Summarize Burn Probability transformers.
Burn Table
Column internal name: FileName
Specifies the file name of the Parquet (.parquet) file containing the raw burn table.
Data Type: String
Description
Column internal name: Description
Optional. Provides a description of the burn table output.
Data Type: String